gt Tables
May 19, 2025
Let’s make a gt table
Create states data frame…
10:00
Let’s make a gt table
| name | q1 | q2 | q3 | q4 | q5 | top5 |
|---|---|---|---|---|---|---|
| District of Columbia | 12971 | 51060 | 94478 | 157803 | 375792 | 670768 |
| New York | 14054 | 42220 | 75647 | 123318 | 302676 | 574063 |
| Utah | 21105 | 51272 | 79517 | 116016 | 239149 | 421379 |
| Oregon | 16014 | 42554 | 70418 | 108483 | 232703 | 404468 |
| Idaho | 16450 | 40433 | 63643 | 95316 | 203042 | 360622 |
| South Dakota | 16002 | 39619 | 64234 | 95810 | 200212 | 358060 |
| Puerto Rico | 2906 | 12144 | 22163 | 38397 | 99043 | 187234 |
Let’s make a good gt table
| Mean Household Income of Quintiles, 2021 | ||||||
|---|---|---|---|---|---|---|
| Seven Representative U.S. States | ||||||
| lowest | second | third | fourth | highest | top 5% | |
| District of Columbia | $12,971 | $51,060 | $94,478 | $157,803 | $375,792 | $670,768 |
| New York | $14,054 | $42,220 | $75,647 | $123,318 | $302,676 | $574,063 |
| Utah | $21,105 | $51,272 | $79,517 | $116,016 | $239,149 | $421,379 |
| Oregon | $16,014 | $42,554 | $70,418 | $108,483 | $232,703 | $404,468 |
| Idaho | $16,450 | $40,433 | $63,643 | $95,316 | $203,042 | $360,622 |
| South Dakota | $16,002 | $39,619 | $64,234 | $95,810 | $200,212 | $358,060 |
| Puerto Rico | $2,906 | $12,144 | $22,163 | $38,397 | $99,043 | $187,234 |
| Source: US Census Bureau, American Community Survey | ||||||
Let’s make a good gt table
goodtable <- gt(states) |>
  tab_header(
    title = "Mean Household Income of Quintiles, 2021",
    subtitle = "Seven Representative U.S. States"
  ) |>
  cols_label(
    name = "",
    q1 = "lowest",
    q2 = "second",
    q3 = "third",
    q4 = "fourth",
    q5 = "highest",
    top5 = "top 5%"
  ) |>
  fmt_currency(
    columns = c(q1:top5),
    currency = "USD",
    use_subunits = FALSE
  ) |>
  # note that you can use markdown (md) to format the source note for html documents
  tab_source_note(source_note = md("**Source**: US Census Bureau, American Community Survey"))

goodtable10:00
Change Colum Width
| Mean Household Income of Quintiles, 2021 | ||||||
|---|---|---|---|---|---|---|
| Seven Representative U.S. States | ||||||
| lowest | second | third | fourth | highest | top 5% | |
| District of Columbia | $12,971 | $51,060 | $94,478 | $157,803 | $375,792 | $670,768 |
| New York | $14,054 | $42,220 | $75,647 | $123,318 | $302,676 | $574,063 |
| Utah | $21,105 | $51,272 | $79,517 | $116,016 | $239,149 | $421,379 |
| Oregon | $16,014 | $42,554 | $70,418 | $108,483 | $232,703 | $404,468 |
| Idaho | $16,450 | $40,433 | $63,643 | $95,316 | $203,042 | $360,622 |
| South Dakota | $16,002 | $39,619 | $64,234 | $95,810 | $200,212 | $358,060 |
| Puerto Rico | $2,906 | $12,144 | $22,163 | $38,397 | $99,043 | $187,234 |
| Source: US Census Bureau, American Community Survey | ||||||
Change Colum Width
Change Font
| Mean Household Income of Quintiles, 2021 | ||||||
|---|---|---|---|---|---|---|
| Seven Representative U.S. States | ||||||
| lowest | second | third | fourth | highest | top 5% | |
| District of Columbia | $12,971 | $51,060 | $94,478 | $157,803 | $375,792 | $670,768 |
| New York | $14,054 | $42,220 | $75,647 | $123,318 | $302,676 | $574,063 |
| Utah | $21,105 | $51,272 | $79,517 | $116,016 | $239,149 | $421,379 |
| Oregon | $16,014 | $42,554 | $70,418 | $108,483 | $232,703 | $404,468 |
| Idaho | $16,450 | $40,433 | $63,643 | $95,316 | $203,042 | $360,622 |
| South Dakota | $16,002 | $39,619 | $64,234 | $95,810 | $200,212 | $358,060 |
| Puerto Rico | $2,906 | $12,144 | $22,163 | $38,397 | $99,043 | $187,234 |
| Source: US Census Bureau, American Community Survey | ||||||
Change Font
Center
| Mean Household Income of Quintiles, 2021 | ||||||
|---|---|---|---|---|---|---|
| Seven Representative U.S. States | ||||||
| lowest | second | third | fourth | highest | top 5% | |
| District of Columbia | $12,971 | $51,060 | $94,478 | $157,803 | $375,792 | $670,768 |
| New York | $14,054 | $42,220 | $75,647 | $123,318 | $302,676 | $574,063 |
| Utah | $21,105 | $51,272 | $79,517 | $116,016 | $239,149 | $421,379 |
| Oregon | $16,014 | $42,554 | $70,418 | $108,483 | $232,703 | $404,468 |
| Idaho | $16,450 | $40,433 | $63,643 | $95,316 | $203,042 | $360,622 |
| South Dakota | $16,002 | $39,619 | $64,234 | $95,810 | $200,212 | $358,060 |
| Puerto Rico | $2,906 | $12,144 | $22,163 | $38,397 | $99,043 | $187,234 |
| Source: US Census Bureau, American Community Survey | ||||||
Center
Add Borders and Lines
| Mean Household Income of Quintiles, 2021 | ||||||
|---|---|---|---|---|---|---|
| Seven Representative U.S. States | ||||||
| lowest | second | third | fourth | highest | top 5% | |
| District of Columbia | $12,971 | $51,060 | $94,478 | $157,803 | $375,792 | $670,768 |
| New York | $14,054 | $42,220 | $75,647 | $123,318 | $302,676 | $574,063 |
| Utah | $21,105 | $51,272 | $79,517 | $116,016 | $239,149 | $421,379 |
| Oregon | $16,014 | $42,554 | $70,418 | $108,483 | $232,703 | $404,468 |
| Idaho | $16,450 | $40,433 | $63,643 | $95,316 | $203,042 | $360,622 |
| South Dakota | $16,002 | $39,619 | $64,234 | $95,810 | $200,212 | $358,060 |
| Puerto Rico | $2,906 | $12,144 | $22,163 | $38,397 | $99,043 | $187,234 |
| Source: US Census Bureau, American Community Survey | ||||||
Export Table
Not a Good Table
| name | estimate | lower_90 | upper_90 |
|---|---|---|---|
| Barnstable | 40442 | 39554 | 41330 |
| Berkshire | 33040 | 32074 | 34006 |
| Bristol | 36910 | 36347 | 37473 |
| Dukes | 40119 | 34791 | 45447 |
| Essex | 39756 | 39174 | 40338 |
| Franklin | 34775 | 33712 | 35838 |
| Hampden | 32262 | 31707 | 32817 |
| Hampshire | 30795 | 29868 | 31722 |
| Middlesex | 51808 | 51337 | 52279 |
| Nantucket | 45717 | 38260 | 53174 |
| Norfolk | 52591 | 51991 | 53191 |
| Plymouth | 43684 | 43014 | 44354 |
| Suffolk | 39200 | 38624 | 39776 |
| Worcester | 39009 | 38454 | 39564 |
Use Confidence Intervals Instead
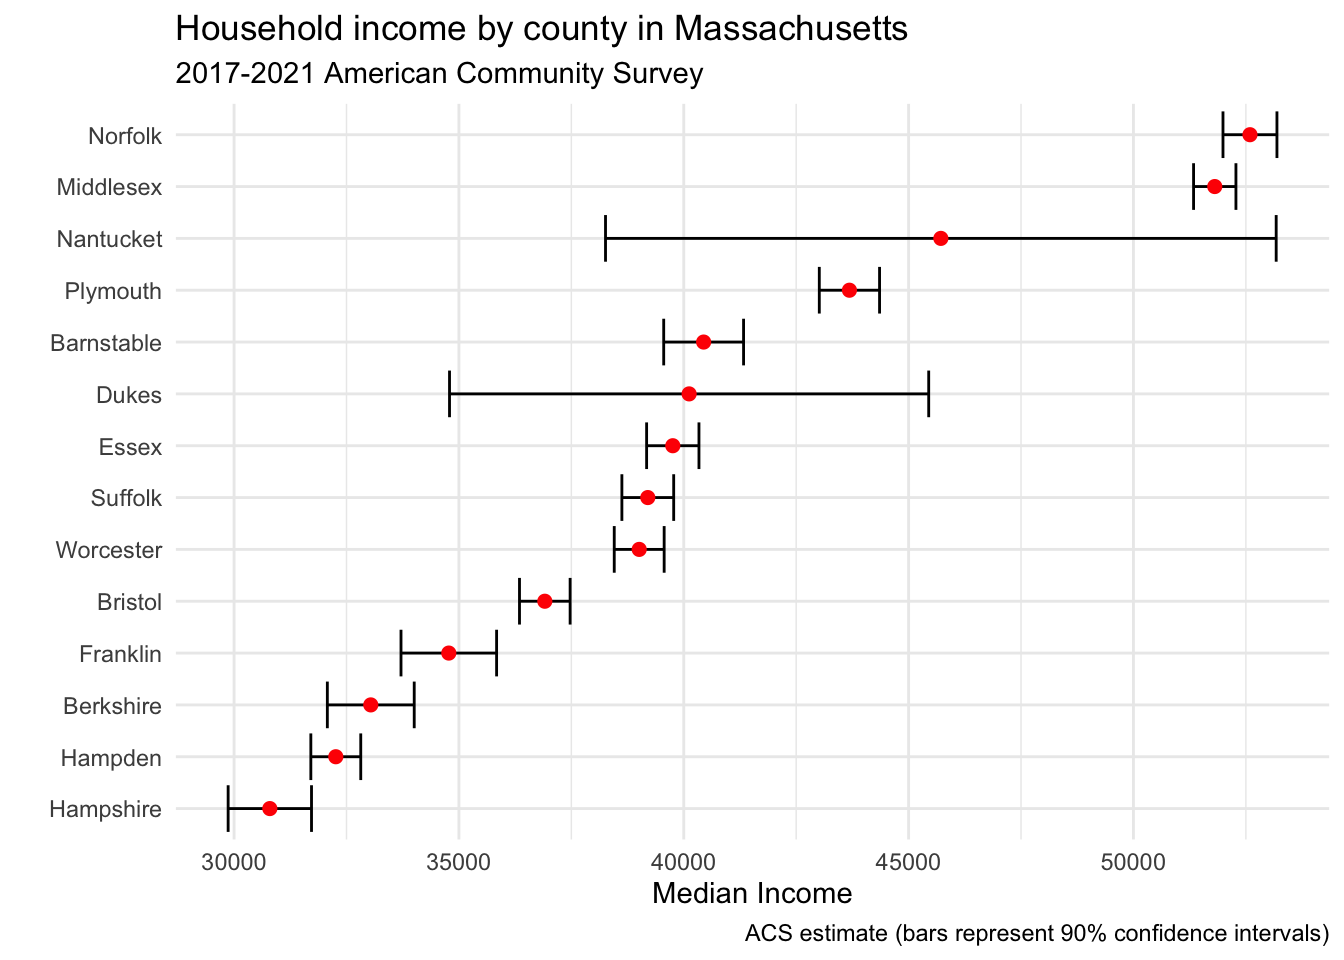
Use Confidence Intervals Instead
library(ggplot2)

mass_med_inc |>
  ggplot(aes(x = estimate, y = reorder(name, estimate))) +
  geom_errorbar(aes(xmin = lower_90, xmax = upper_90)) +
  geom_point(color = "red", size = 2) +
  labs(title = "Household income by county in Massachusetts",
       subtitle = "2017-2021 American Community Survey",
       y = "",
       x = "Median Income",
       caption = "ACS estimate (bars represent 90% confidence intervals)") +
  theme_minimal()