Quantitative Analysis for IA Practitioners
IAFF 6501
Welcome!
Professor Eric Kramon (ekramon@gwu.edu)
Office Hours: Wednesdays, 12:30-2:30, Monroe Hall office 472 (or by appointment)
Teaching Assistant
Audrey Straw (audrey.straw@gwmail.gwu.edu)
Office Hours: Thursdays, 3:30-5 (Zoom)
Data Analysis in IA
![]()
Data Analysis in IA
![]()
Data Analysis in IA
![]()
![]()
Course Objectives
Overarching goal: Provide you with data analysis skills that:
You can use in your IA (or other) career
Provide a foundation (and possibly interest!) for more advanced courses in the future
Will allow you to understand, interpret, and critically engage with the data analysis and conclusions of others.
Sections of the Course
- Data Visualization
- Summarizing and communicating effectively with data
- Statistical Inference
- Making rigorous conclusions from data
- Modeling
Skills/knowledge you will pick up along the way
R coding skills (and RStudio), with focus on “tidy” approach and reproducible research
Quarto (html documents, PDFs, presentations, websites, books, blogs, …)
How to access and “clean” data so that you can analyze it
When you hear terms like “machine learning”, you’ll have some sense of what people are talking about
How do I get an A (requirements)
Weekly quizzes (20 percent)
3 Data Analysis Assignments (45 percent; 15 percent each)
Final Project Preliminary Assignments
- Abstract - what do you want to do, what is the data you will use (5 percent)
- EDA, Preliminary data viz, + analysis plan (10)
Final Project (20 percent)
Class Structure
Most classes will be divided into four parts:
Lecture topic A
In class coding work on topic A
Lecture topic B
In class coding work on topic B
Let’s get going . . .
Your first Data Visualizations
(and making sure we have R and RStudio installed and ready to roll)
Let’s get going . . .
First, you need to make sure you have R and RStudio installed on your machine.
We will come around to help if you need it
After that, work one one of the three examples
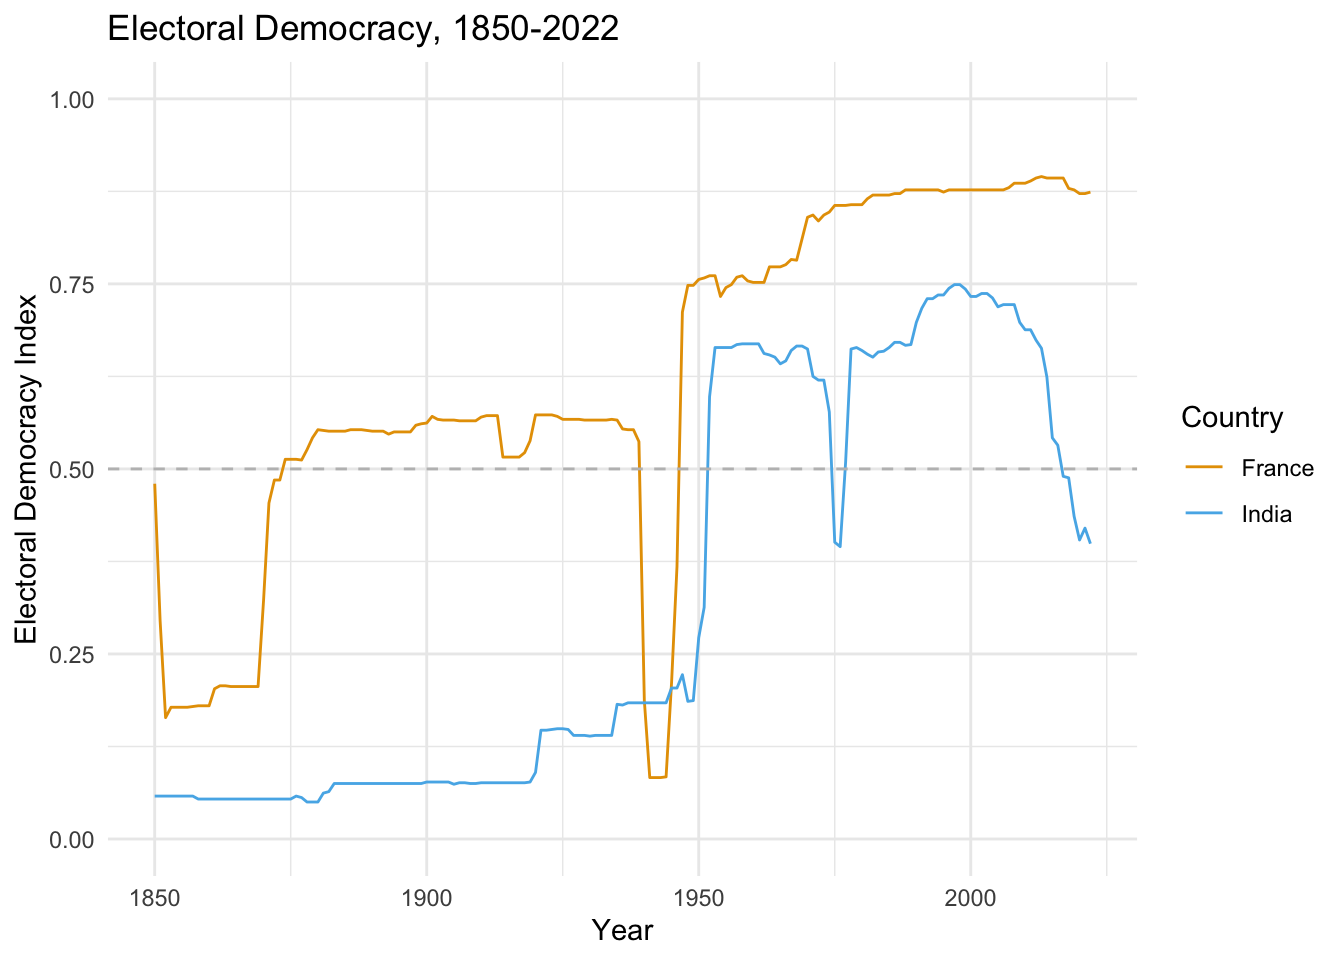
Example: Plotting Democracy Over Time
![]()
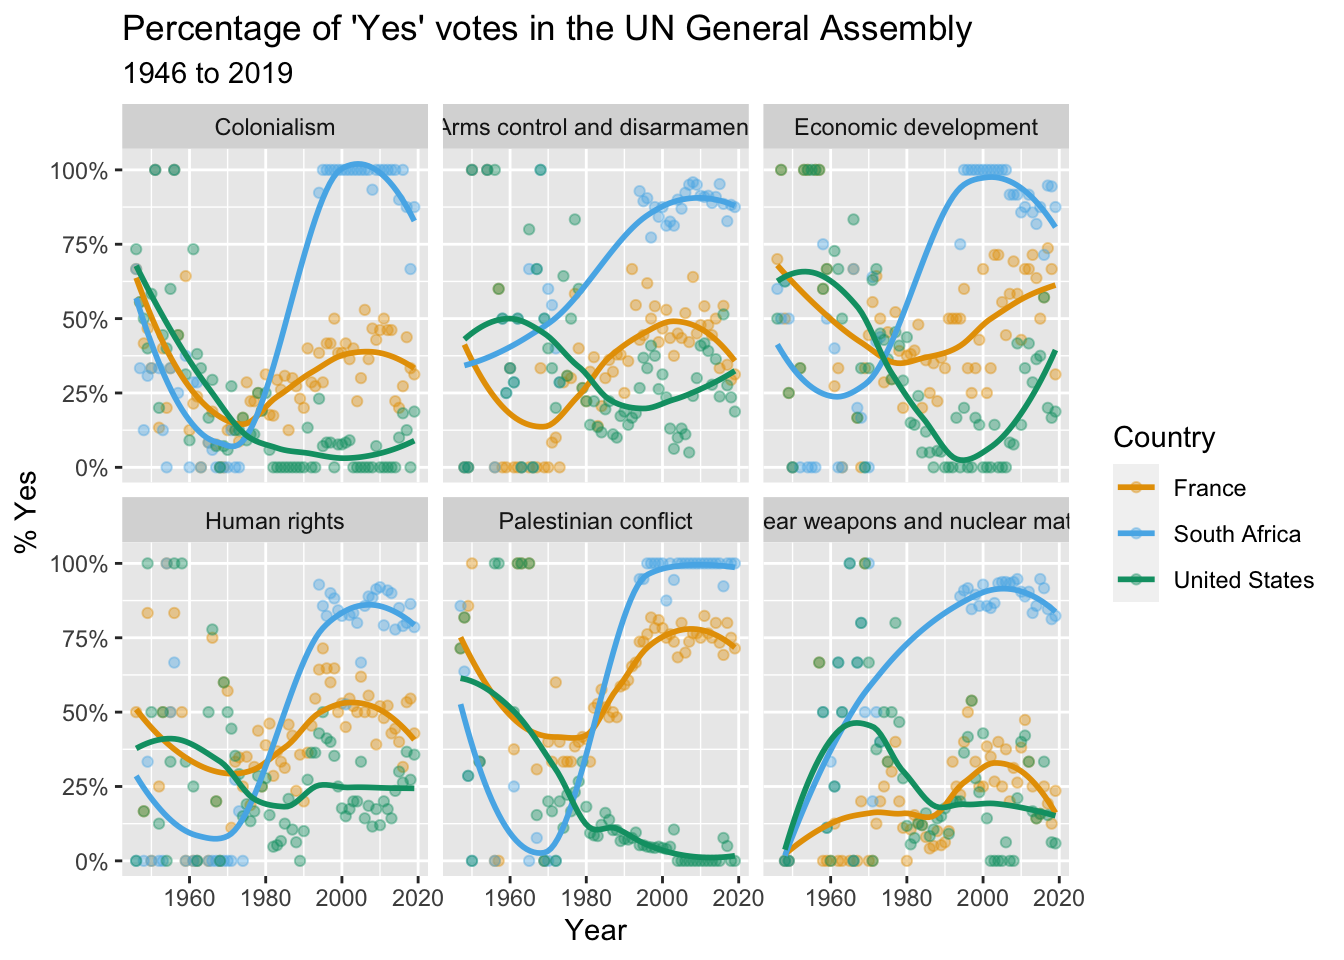
Example: UN Voting Trends
![]()
Before we dive in
We need to get to know R, RStudio, and Quarto…
Your Task
Make sure R and RStudio installed (we can help if needed)
Create a folder for this class somewhere on your machine.
- Create a sub-folder called “classwork”
- save week1-classwork.qmd in that folder
Open the week1-classwork.qmd file in RStudio, which has code for 3 data viz activities
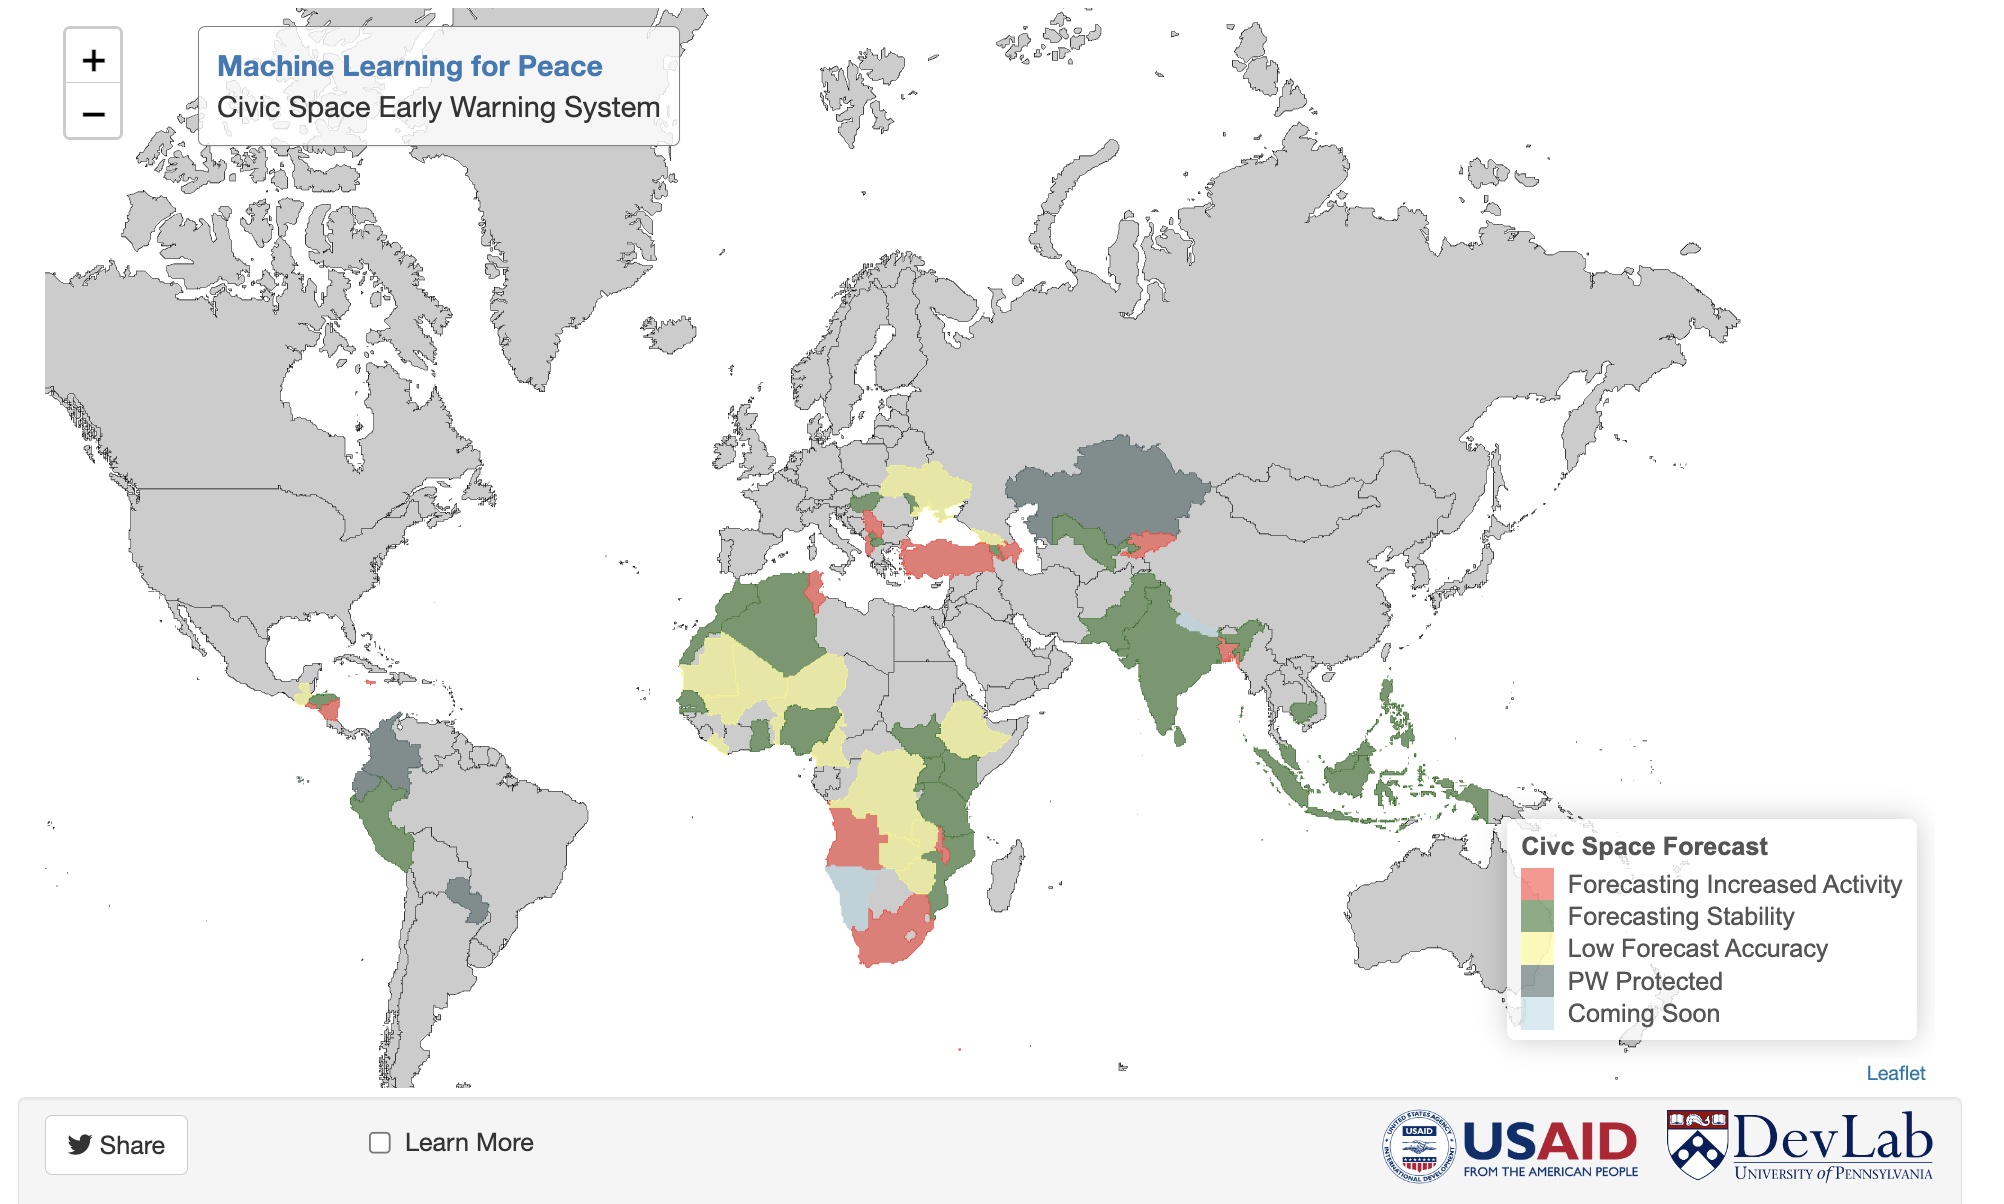
- Map making
- Democracy Over Time
- UN Voting patterns
Follow the instructions to update the code
Click Render to update your HTML output and examine
Complete as much as you can (no problem if you do not finish)