Plotting Confidence Intervals
May 19, 2025
Plot
Code
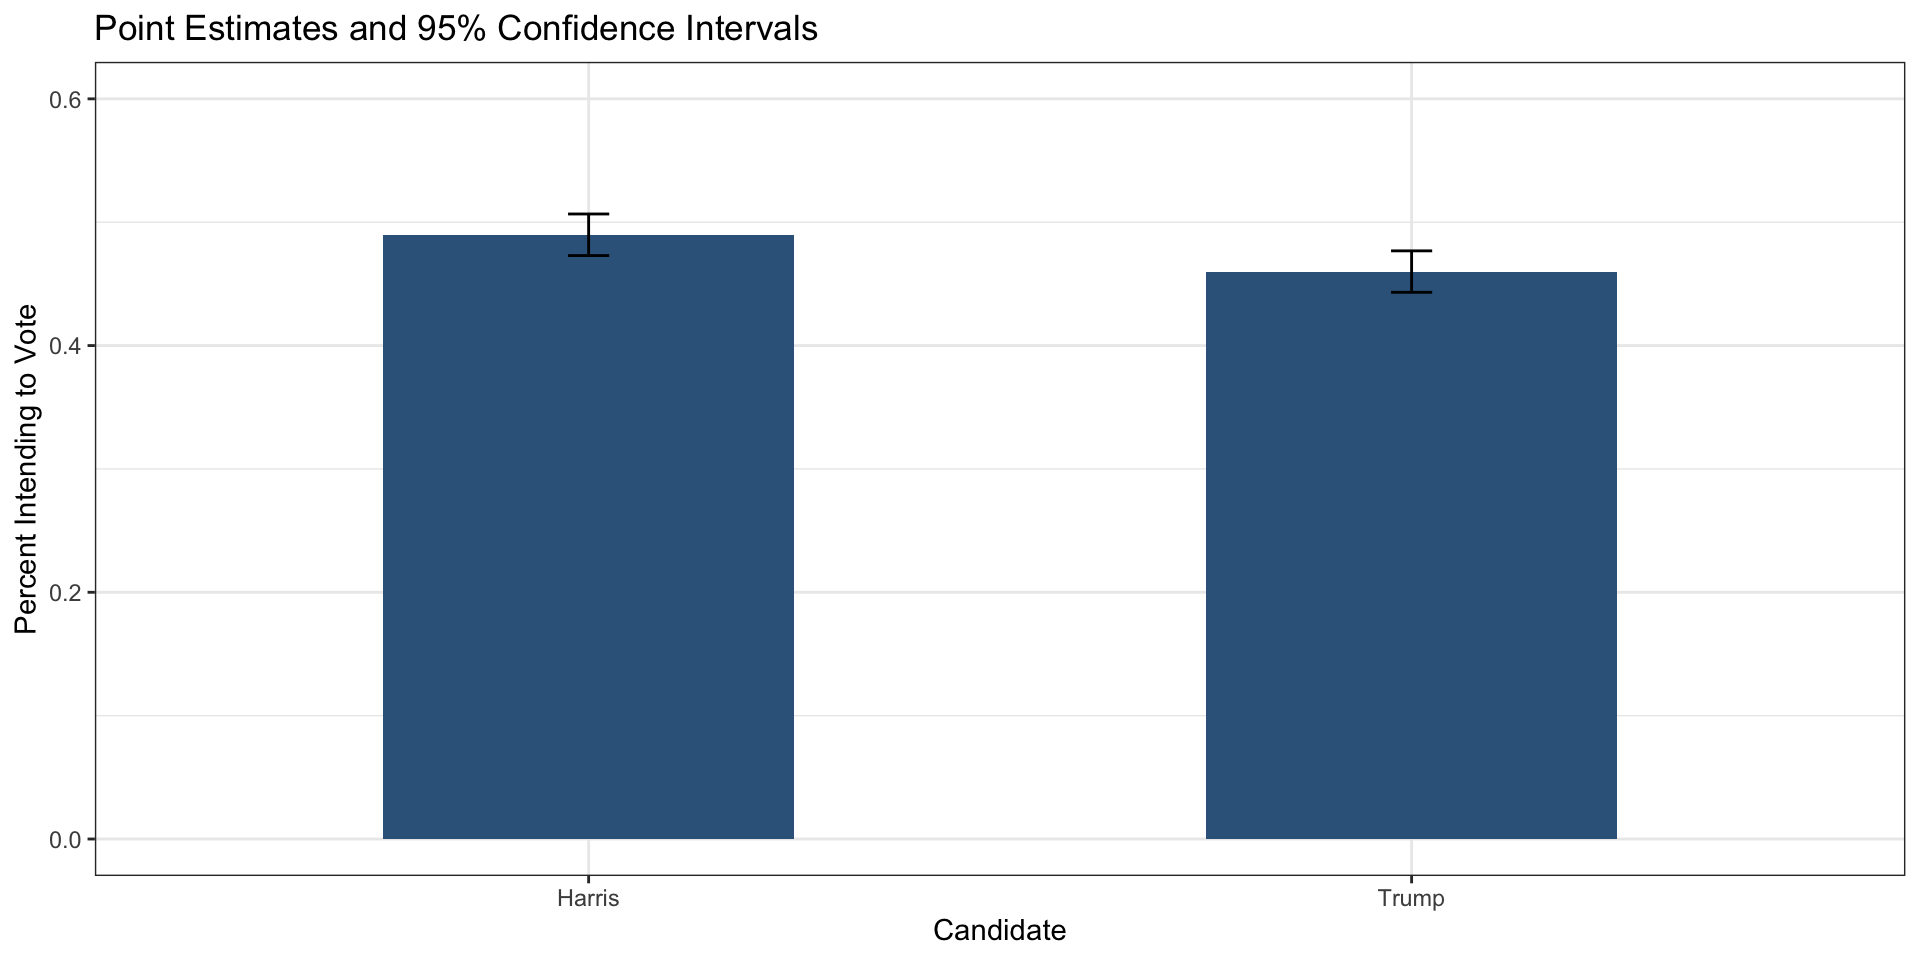
Point Estimates with CI
Code
ggplot(plotData, aes(y = estimate, x = candidate, ymin = conf.low, ymax = conf.high)) +
  geom_point() +
  geom_errorbar(width = .05) +
  theme_bw()  +
 ylim(.4, .6) +
  labs(x = "Candidate",
       y = "Percent Intending to Vote",
       title = "Vote Intention in 2024",
       subtitle = "Point Estimates and 95% Confidence Intervals") +
  geom_hline(yintercept = .5, linetype = "dashed", color = "grey")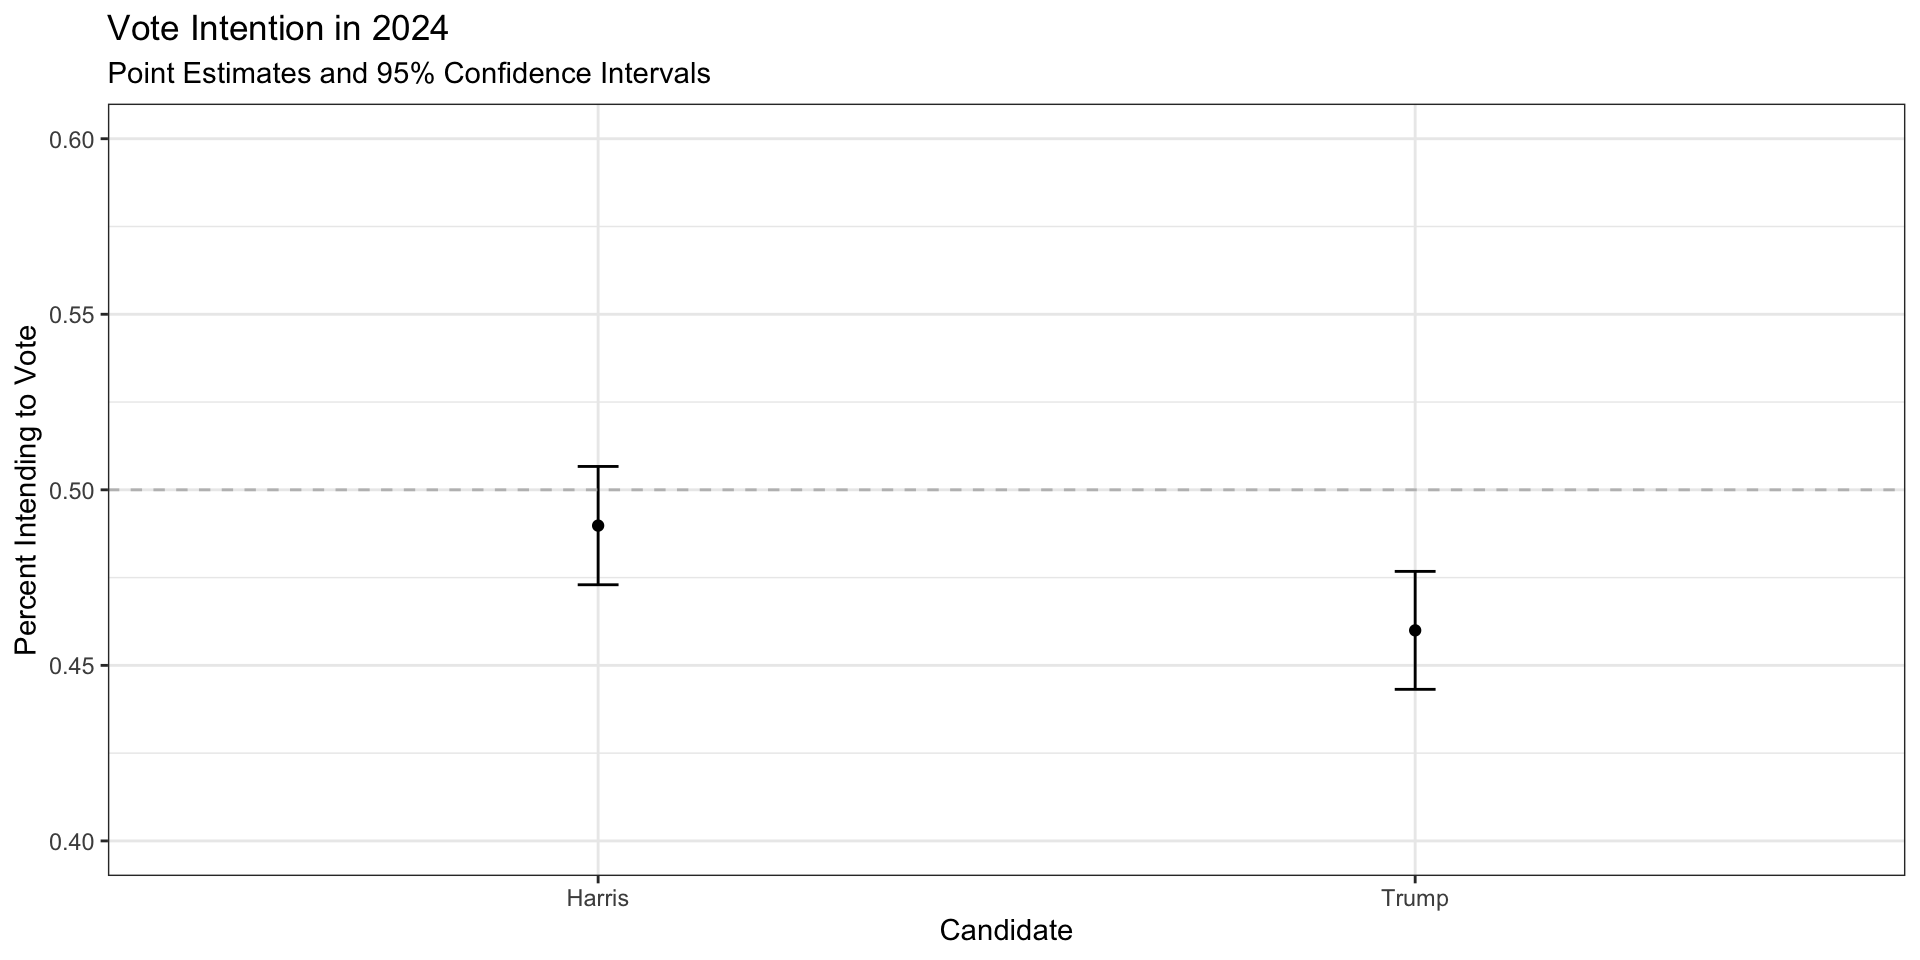
–>
–>
–> –> –> –> –> –>
![]()