Modeling

May 19, 2025

Modeling

  • Use models to explain the relationship between variables and to make predictions
  • Explaining relationships [usually interested in causal relationships, but not always]

    • Does oil wealth impact regime type?
  • Predictive modeling

    • Where is violence most likely to happen in [country X] during their next election?

    • Is this email spam?

Modeling

Modeling

Example: GDP per capita and Democracy

Pull in the VDEM Data

library(vdemdata)
modelData <- vdem %>% 
  filter(year == 2019) %>% 
  select(country_name, v2x_libdem, e_gdppc) %>% 
  mutate(lg_gdppc = log(e_gdppc))
glimpse(modelData)
Rows: 179
Columns: 4
$ country_name <chr> "Mexico", "Suriname", "Sweden", "Switzerland", "Ghana", "…
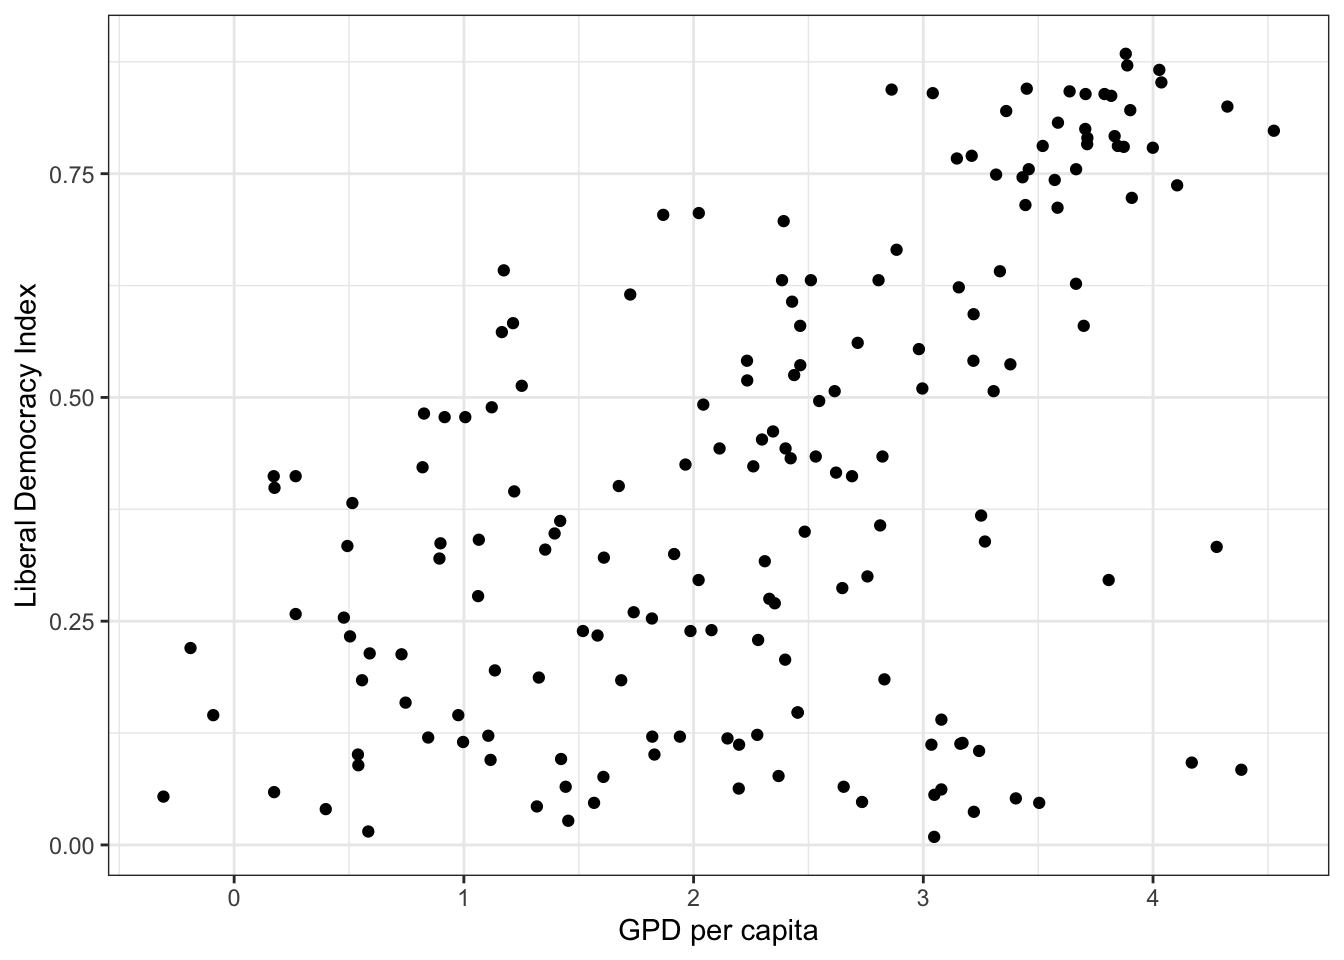
$ v2x_libdem   <dbl> 0.434, 0.580, 0.871, 0.866, 0.615, 0.607, 0.755, 0.260, 0…
$ e_gdppc      <dbl> 16.814, 11.752, 48.804, 56.110, 5.608, 11.345, 39.061, 5.…
$ lg_gdppc     <dbl> 2.8222119, 2.4640234, 3.8878123, 4.0273140, 1.7241941, 2.…

Visualize first!

Add a trend line

Models as functions

  • We can represent relationships between variables using functions

  • A function is a mathematical concept: the relationship between an output and one or more inputs

    • Plug in the inputs and receive back the output

Models as functions

  • Example: The formula y=3x+7 is a function with input x and output y.

    • If x is 5, y is 22,
    • y=3×5+7=22

Language

  • Response variable: Variable whose behavior or variation you are trying to understand, on the y-axis in the plot

    • Dependent variable
    • Outcome variable
    • Y variable

Language

  • Explanatory variables: Other variables that you want to use to explain the variation in the response, on the x-axis in the plot

    • Independent variables
    • Predictors

Linear Model with One Explanatory Variable

  • Y=a+bX
  • Y is the outcome variable
  • X is the explanatory variable
  • a is the intercept: the predicted value of Y when X is equal to 0
  • b is the slope of the line [remember rise over run!]

Language

  • Predicted value: Output of the model function

    • The model function gives the typical (expected) value of the response variable conditioning on the explanatory variables

    • We often call this ˆY to differentiate the predicted value from an observed value of Y in the data

Language

  • Residuals: A measure of how far each case is from its predicted value (based on a particular model)
    • Residual = Observed value (Y) - Predicted value (ˆY)
    • How far above/below the expected value each case is

Residuals

Linear Model

ˆY=a+bX

Linear Model

ˆY=0.13+0.12X

Linear Model: Interpretation

  • ˆY=a+b×X

  • ˆY=0.13+0.12×X

  • How to interpret our estimate of a?

  • ˆY=0.13+0.12×0

  • ˆY=0.13

a is our predicted level of democracy when GDP per capita is 0.

Linear Model: Interpretation

  • ˆY=a+b×X

  • ˆY=0.13+0.12×X

  • How to interpret our estimate of b?

  • ˆY=a+RiseRun×X

  • ˆY=a+ChangeYChangeX×X

Linear Model: Interpretation

  • b=ChangeYChangeX

  • 0.12=ChangeYChangeX

  • 0.12∗ChangeX=ChangeY

Linear Model: Interpretation

  • 0.12∗ChangeX=ChangeY

When ChangeX=1:

  • 0.12=ChangeY
  • b is the predicted change in Y associated with a ONE unit change in X.

Linear Model: Interpretation

Linear Model: Interpretation

Linear Model: Interpretation

Linear Model: Interpretation


Is this the causal effect of GDP per capita on liberal democracy?

Correlation vs Causation


  • The model tells us the association between variables.
  • There could be reverse or cyclical causation: maybe liberal democracy causes GDP per capita (not vice versa)
  • There could be an omitted factor (z) that causes both GDP per capita and liberal democracy.

    • If true, this is a spurious correlation

Questions for you


An economist is interested in the relationship between years of education (X) and hourly wages in dollars (Y). They estimate a linear model with estimates of a and b as follows:

ˆY=9+1.60∗YrsEducation

  • Write a sentence to interpret the estimate of a (the intercept)

  • Write a sentence to interpret the estimate of b (the slope, or coefficient on YrsEducation)

  • What is the predicted hourly wage for those with 10 years of education?

  • Should you interpret this as a causal effect of education? Why or why not?

Intercept


ˆY=9+1.60∗YrsEducation

The model predicts that people with 0 years of education will make 9 dollars an hour.

Slope


ˆY=9+1.60∗YrsEducation

The model predicts that a one year increase in years of education will result in an additional 1.60 dollars per hour in earnings.

Predicted Hourly Wage for 10 yrs Education

9 + 1.6*10
[1] 25

Next step

  • Linear model with one predictor: Y=a+bX

  • How do we figure out what the best values are for a and b??

IAFF 6501 Website

1 / 32
Modeling May 19, 2025

  1. Slides

  2. Tools

  3. Close
  • Modeling
  • Modeling
  • Modeling
  • Modeling
  • Example: GDP per capita and Democracy
  • Pull in the VDEM Data
  • Visualize first!
  • Add a trend line
  • Models as functions
  • Models as functions
  • Language
  • Language
  • Linear Model with One Explanatory Variable
  • Language
  • Language
  • Residuals
  • Linear Model
  • Linear Model
  • Linear Model: Interpretation
  • Linear Model: Interpretation
  • Linear Model: Interpretation
  • Linear Model: Interpretation
  • Linear Model: Interpretation
  • Linear Model: Interpretation
  • Linear Model: Interpretation
  • Linear Model: Interpretation
  • Correlation vs Causation
  • Questions for you
  • Intercept
  • Slope
  • Predicted Hourly Wage for 10 yrs Education
  • Next step
  • f Fullscreen
  • s Speaker View
  • o Slide Overview
  • e PDF Export Mode
  • b Toggle Chalkboard
  • c Toggle Notes Canvas
  • d Download Drawings
  • ? Keyboard Help